Minimizing Contact Between Student Pathways Through Search Algorithms
- Hyun Min (Eddie) Kim
- Nov 12, 2020
- 14 min read

Abstract
This study aimed to design and create algorithms to minimize student-to-student contacts in schools as students travel by walking through hallways. Depth First Search was used with heuristics and two different factors of this process were tested: the impact of the maximum depth and maximum distance difference on calculation time and on the percentage of decrease in student-to-student contacts after contact minimization. It was determined that both factors had no significant impact on changing the amount of decrease in the number of contacts. The search function took the least amount of time when the maximum depth of search was below the maximum number of depths that it takes for any node on a map to reach another node on the map. The square of the MDD value was proportional to the time that the algorithm took to finish calculation, positively correlated to the calculation time.
Introduction
Schools around the US are currently divided on their approaches to providing students with education amidst this global coronavirus pandemic. Some have decided to take the risk and open up the school to students with their respective precautionary measures; others have been hesitant to do so, instead opting to provide the students with an online learning experience. Although both are viable means of education, both have their downsides: those learning online have expressed their concerns about getting headaches and having dry eyes while those going back to school conveyed their fears of getting the coronavirus in the school building where it is hard for students to practice social distancing As schools are currently finding ways to best instill precautionary measures to lessen a sudden outbreak of Covid-19 in the school, the main two considerations are how to decrease the probability of transmission in classrooms and hallways. Both are important issues, and this project was started to help address the problems of student to student contact in hallways.
Keeping an appropriate distance from another student is not always viable, especially in hallways in the central area of the school that students often use. This was especially evident in the pictures of hallways posted by students from schools that had reopened The students were moving through narrow hallways, trying to squeeze their way to their next class. To combat this issue and lower the chance of coronavirus spread, it would be most ideal to direct students to specific hallways when traveling from class to class to minimize contact between students. This study was done to create an algorithm that finds the most ideal paths for all students to take from class to class - not to necessarily have all students constant the same number of people, but to lessen the overall amount of student-to-student contact. By using a pathfinding algorithm in conjunction with a contact-lessening heuristic, the best paths for each student can be found The application of methods found in this study has been used to provide schools a method to lessen the possibility of outbreak within the building. The test was done based on a specific school but with correct and structured data, these functions can be implemented to any school.
In conjunction with the basic pathfinding algorithms, several optimization techniques were used, aiming to lessen the amount of calculations and thus the amount of time it takes to calculate paths for all students. The best method to be implemented will be the least time-consuming method found with certain variations of parameters. Another optimization-related function, the one that linearly assigns paths for students will be tested for the rounds of optimization necessary to reach the optimal value.
The algorithm used for pathfinding was an optimized version of depth first search which has a complexity of O(V + E), where V is the number vertices and E is the number of edges The complexities of the algorithms are reduced with different heuristics, altered when the algorithm is running. The heuristics are dependent on cases where the heuristics evaluate as true - this will be explored later. These are needed because the structure of the school map was represented with a graph data structure, allowing for cases where the algorithm goes down a large amount of depths and circles around to the start node rather than the target node.
Material and Methods
Tools Used:
- School Map
- Javascript
This project can be found at https://github.com/gomgom03/Student-Path-Project---GBN .
Preparing Test Map:
The mapping for the initial test was done on a school floor guide, placing nodes on places that intersect and connecting the nodes with edges that represent the hallways. The staircases were also considered hallways, connecting a point on the bottom floor to the top floor. Thus, the 3d structure of the schools was flattened to a 2d one. The distance of each hallway edge was measured via Google Earth. Each classroom in the map was attached to either a hallway or a node.
Importing and Storing Map Data:
The data of the test map was represented in three .txt files that had the linkage relationships between the rooms, the edges, and the nodes. These three files are ultimately used to create and store the hallways, intersection points, and the rooms. For ease of reference, a circular data structure is used so that all javascript objects have properties that point to all of the other objects they’re linked to. For example, hallway “A” may have a link to joint “1”, which would also have a link back to hallway “A”. All of this data is stored in the gbnData object. Because all are linked together, this resembles a graph data structure.
Important Stored Values (Table of Parameters):
The most important and variable values were stored in the param objects located in the global score. These can be changed by the user.
The maxDistDiff is used for limiting the maximum distance that the search function can exceed from the shortest possible distance found. For example, the default value for the maxDistDiff is 1.2, indicating that if the pathfinding algorithm found the path that is 100m long, then the algorithm will now only look for paths that are 100*1.2 = 120m in length or shorter. This value is used because it is unreasonable to have a student go on a 5 minute walk to class when the student can take a much shorter path that only takes 30 seconds.
The initialDepth is the number of depths the algorithm goes down on the graph data structure. This was also a measure like maxDistDiff that limited how far the algorithm went down on the graph to search for the target node. Without this value, each searching process would take an unnecessarily long time, especially if the first depth the program tried didn’t contain the target node. However, if the algorithm doesn’t find any paths with the given initialDepth value, the algorithm will proceed to ignore this value and search with an indefinite depth.
The traceRemainTime is just like how it sounds. It is the amount of time in seconds that trace of the coronavirus stays airborne in a hallway, making it possible for others to get infected. Therefore, with this value, if student A goes into one hallway and student B goes into the same hallway after a time period less than the traceRemianTime value, the algorithm counts this interaction as an indirect student-to-student contact instance.
The avgPace is the most straightforward - it stores the value of the walking pace of the human being in meters per second. The default value found is 3.1 m/s.
The minimizeIteration value is the number of times the path optimization algorithm is run for all the student objects. Since the optimization is linear, the algorithm may have to run various times to make each student path optimal.
The period value is the current school period for which the algorithm is being calculated.
Creating an Asynchronous Counter Object:
An asynchronous counter object is created because there is no built-in javascript function that indicates that all of the asynchronous tasks requested by the user have been resolved. This counter has a maximum count set to know when everything is done to prompt the next action. A callback is an attachable option of the counter, and this callback function is called after the count of tasks finished is the same as the maximum count. Since the code run for testing is mostly made up of asynchronous functions, this counter is used for various parts of the process.
Finding Paths from a Point to another Point or Hallway:
A function called pointPathSearch is used to find all paths between a point and another point/hallway. The start and end points are set before this function is called and when called with it, all variables applicable are stored within the function scope. To have the function running without blocking other javascript code executing in the background of the browser, most operations, especially the heavy ones, are handled asynchronously. The pathfinding algorithm used is a variation of depth-first search with maxDistDiff and initialDepth comparisons as heuristics that make the process more efficient. All of the paths for each student is stored in the studentPaths object, with the student id as the key and an array of paths as the value. The pointPathSearch function can be used for both general pathfinding and for the findMaxDepth function. After running this function for the GBN map, the value 15 was found. Therefore, the biggest of the minimum paths from a point in this map to another point in the map was 15 depths. The significance and the viability of using this value as the maxDistDiff value within the tool was explored in the study by comparing the time it took for various maxDistDiff values, including 15.
Iterating Pathfinding Function Over All Student Objects:
For the student pathfinding functionality, the all_spf function calls the studentPathFind function for all students stored in the imported student data, which in turn calls the pointPathSearch function. All of the input variables must be well-structured and accurate for all values to be stored in the right place in the right format. The studentPathFind is especially important as it is responsible for differentiating between a student that starts in a classroom connected to a hallway and a student that starts in a classroom connected to a joint. When passing these functions, an asyncCounter is initialized, having the all_minContact function as callback and the max value equal to the amount of students. The add property that serves as a function in the asyncCounter is called in the pointPathSearch’s resolveFind function.
Figuring Out the Maximum Depth Between Two Points on a Map:
The findMaxDepth function was created to find the maximum number of depths that it takes for any node on a map to reach another node on the map. This is the function that can be used to determine the value of the initialDepth parameter. Using the map data imported from the .txt files and extracting all the nodes/joints on the map, the least depth from each node to all other nodes is found, and the maximum value of the least depth of all the point-to-point paths are found and returned. This returned value can also be stored as the actual initialDepth value for use in the pathfinding step.
Data Collection:
The test was done on one computer for all trials without any variations in performance. A test environment was set up with adequate CPU power, more than enough to prevent CPU spikes and inaccuracies in performance data. The computer did not have to be equipped with a large amount of RAM because most of the calculation data stored within functions were never used again, allowing the garbage collector to free up the space. The variations made to the trails were the initialDepth and maxDistDiff values. The tests were done on 3 different randomly generated student data which randomly assigned the starting and ending points of all the students for which the paths were calculated. For each trial, the amount of time taken for the calculations to complete was found based on the computer’s internal clock in milliseconds. Along with this, the amount of student-to-student contact after each run of the minimization function was collected, up to ten runs. Since all of these were repeated three times for precision, the computer did a total of 180 tests.
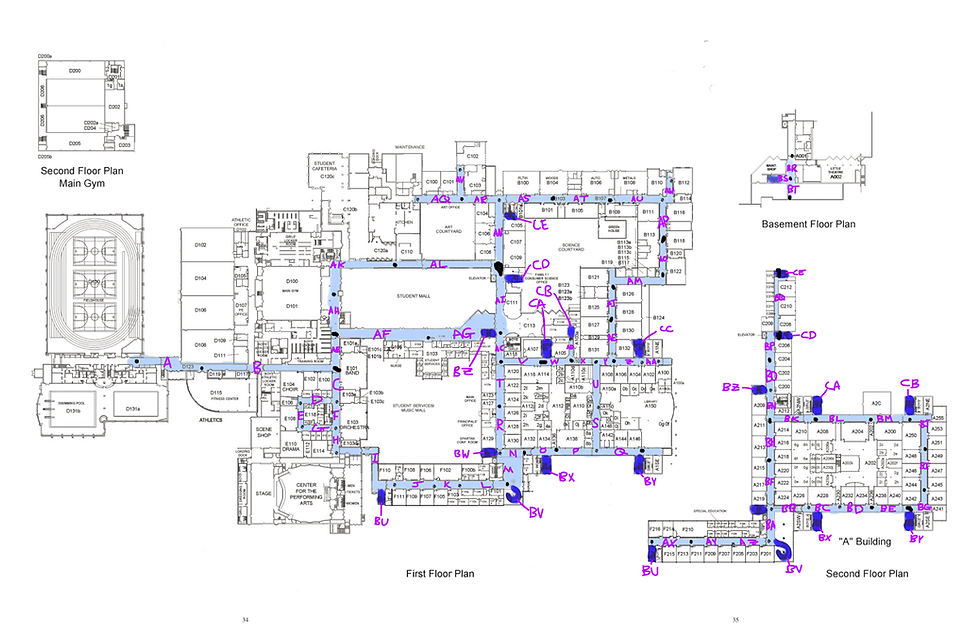
Figure 1. Mapping of School (See reference 4.)


Results
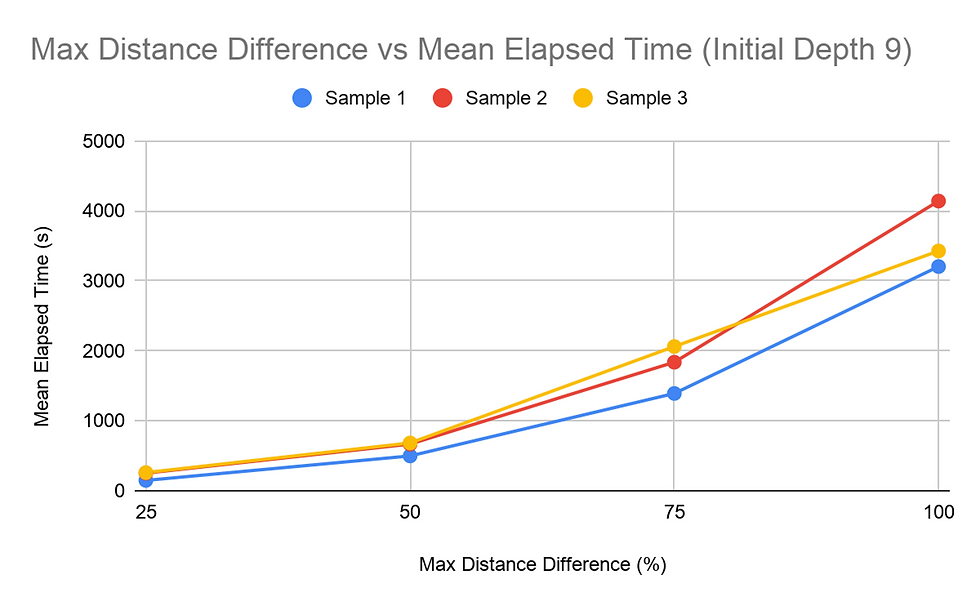
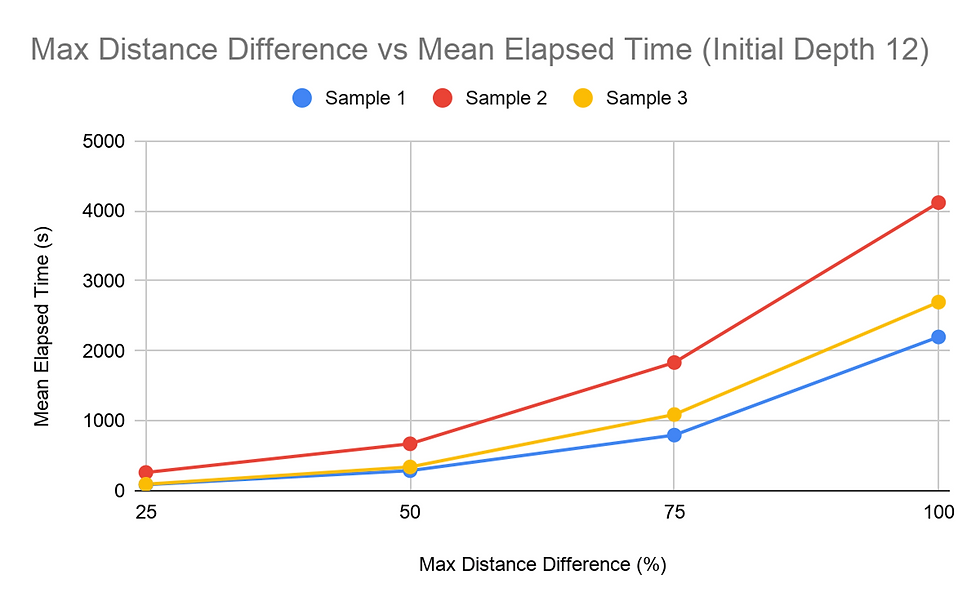
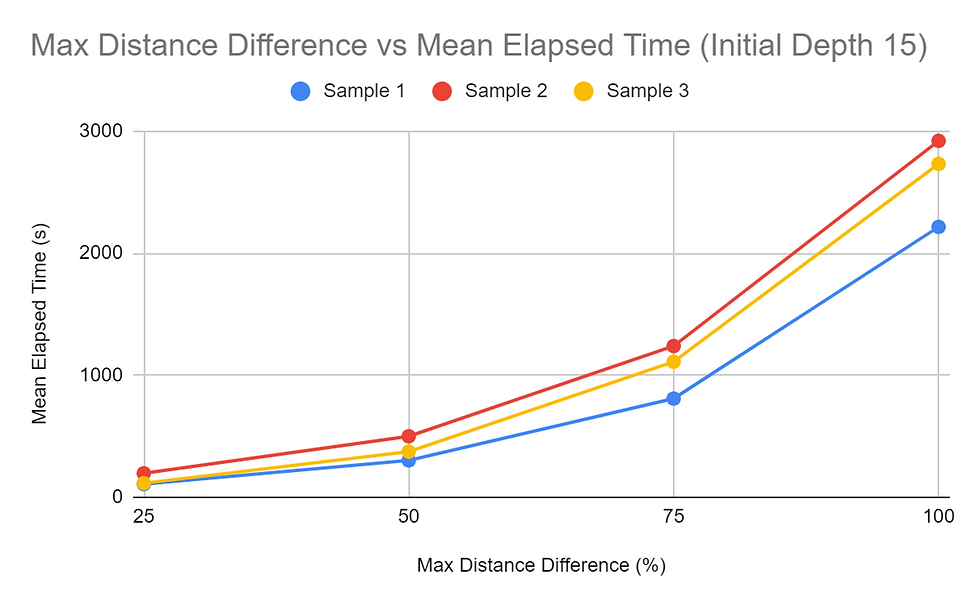
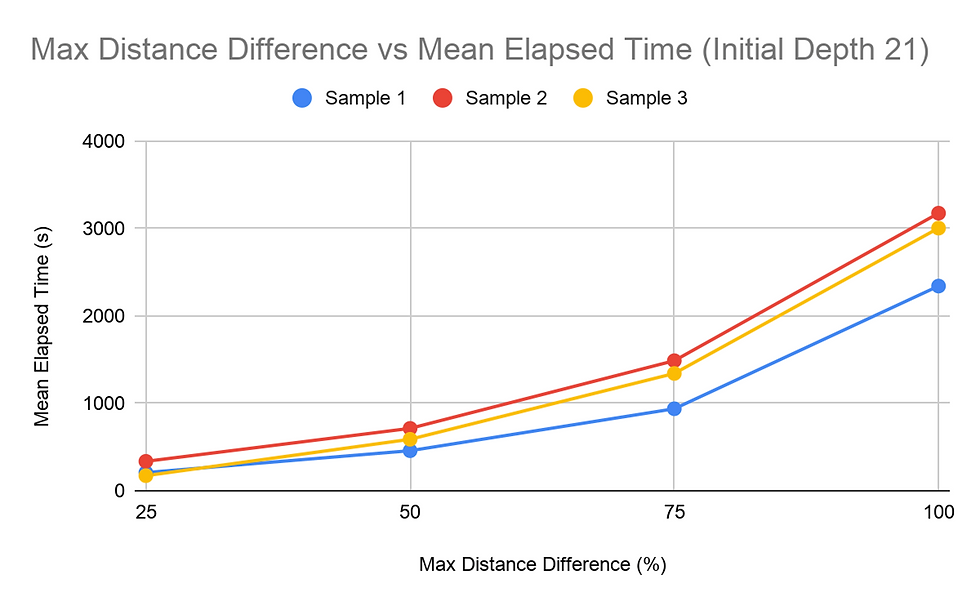
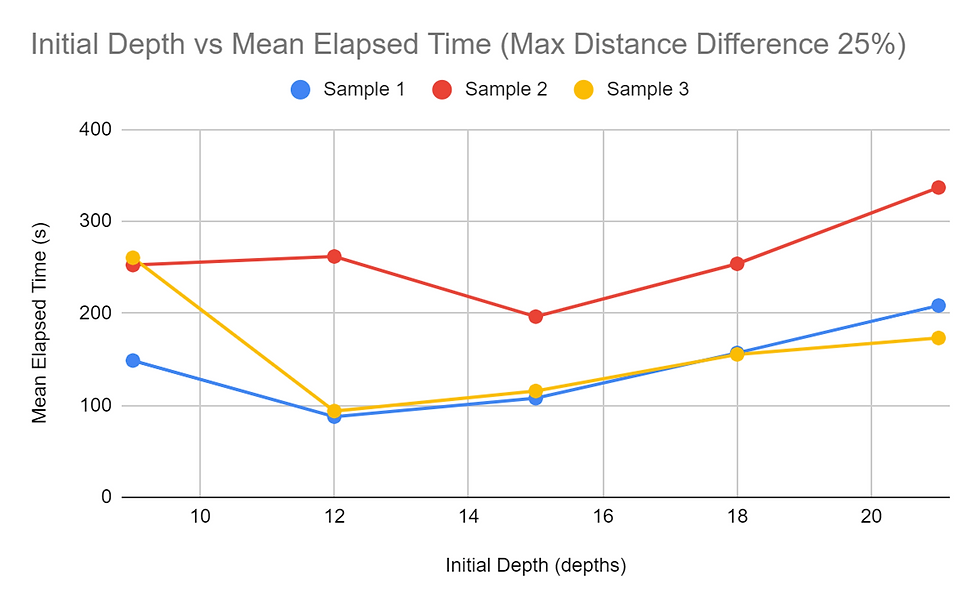
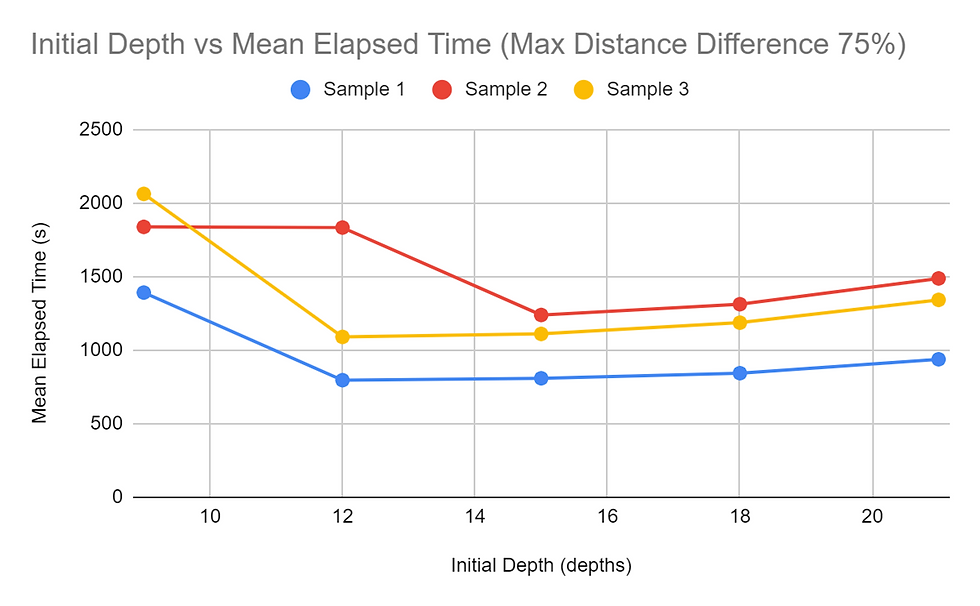
When considering the amount of time, it takes for the pathfinding function to complete, it was found that the higher the Maximum Distance Difference (MDD) value, the longer it takes for all the paths to be found. This was shown in all tests and consistently throughout the tests of the three different samples, regardless of the Initial Depth (ID) value. All graphs obtained for the MDD tests showed a concave up graph, indicating that the rate of change increased as the MDD percentage increased. The MDD vs time graphs were also consistent in the order of the samples regarding the time it took with each configuration of the trails. Sample 2 mostly took the longest to compute, and Sample 3 and Sample 1 followed behind. The difference between the time it took for 25% MDD and 100% MDD configurations were significant for all trial sets. The 100% MDD configuration trials took at least 9 times the amount of time it took the 25% MDD configuration trials, and some also went as high as 20+ times the respective 25% MDD trial. Additionally, each 25% increase in MDD the time of calculation. The same data collected with the dependent variable as time was reorganized to view how ID affected the run time of the algorithms. The trends for the Samples 1 and 3 trials were similar, decreasing then slightly increasing. Peculiarly, the trials for Sample 2 were slightly different, increasing slightly from 9 to 12, then increasing and decreasing as the trials for the two other samples did.
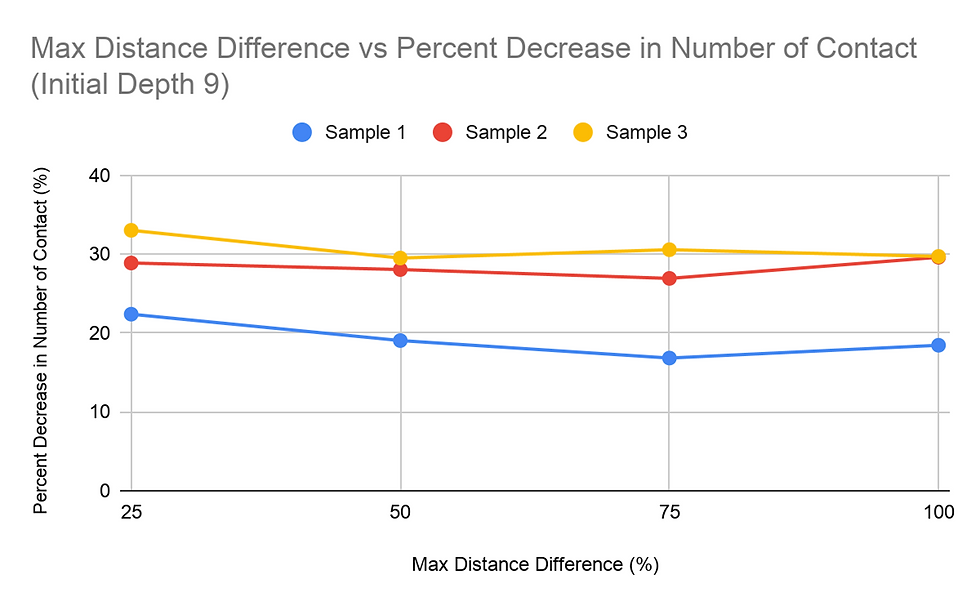
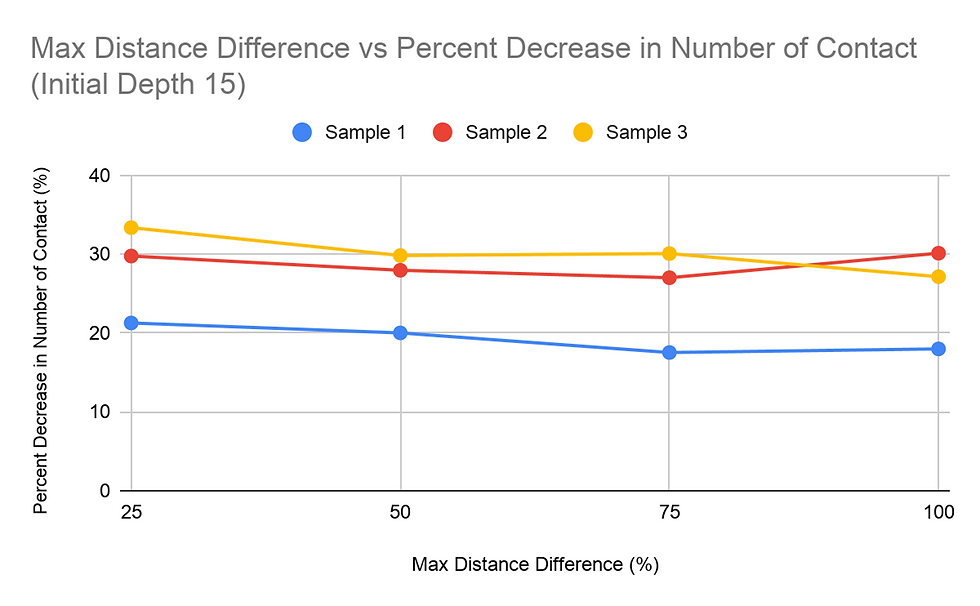
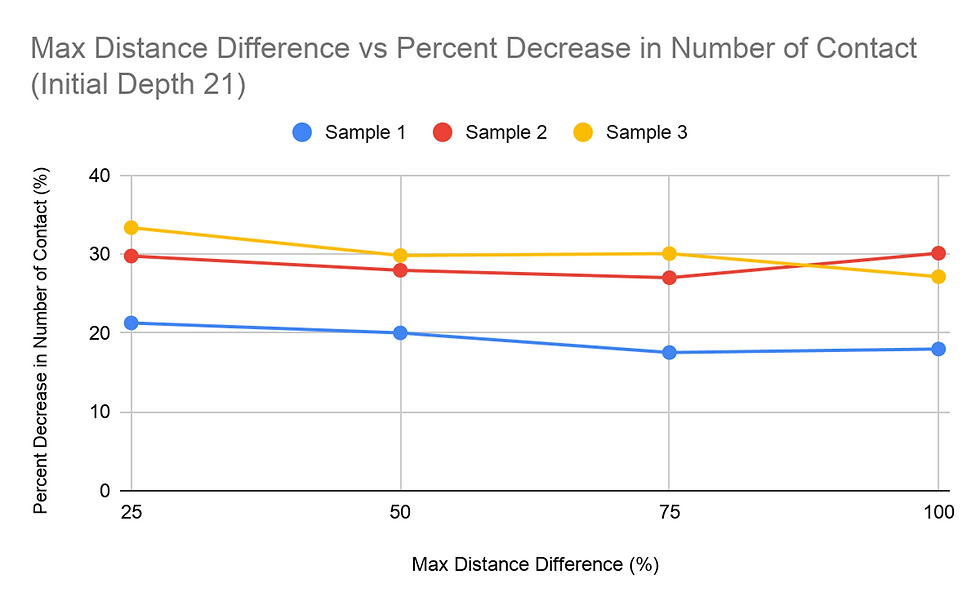
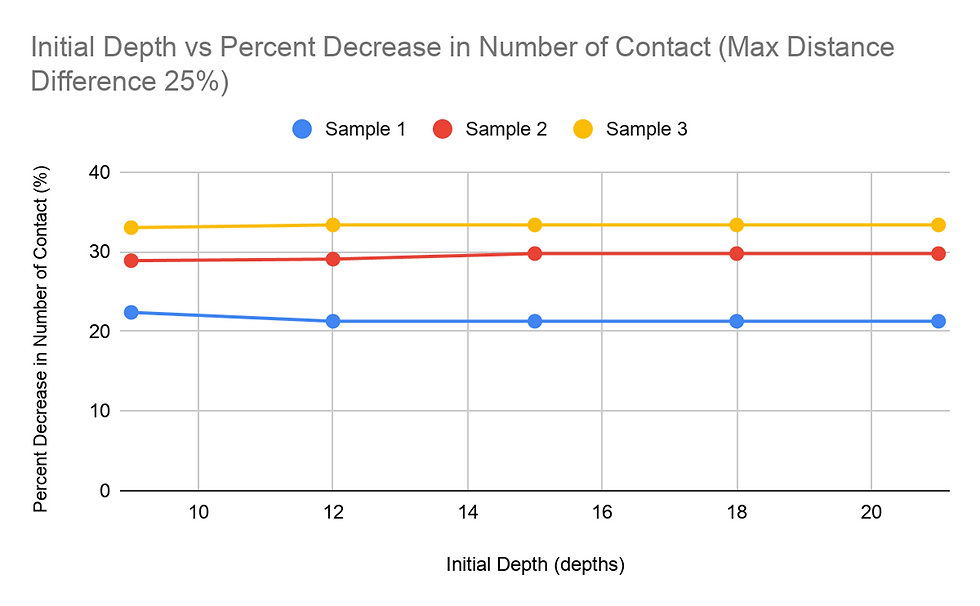
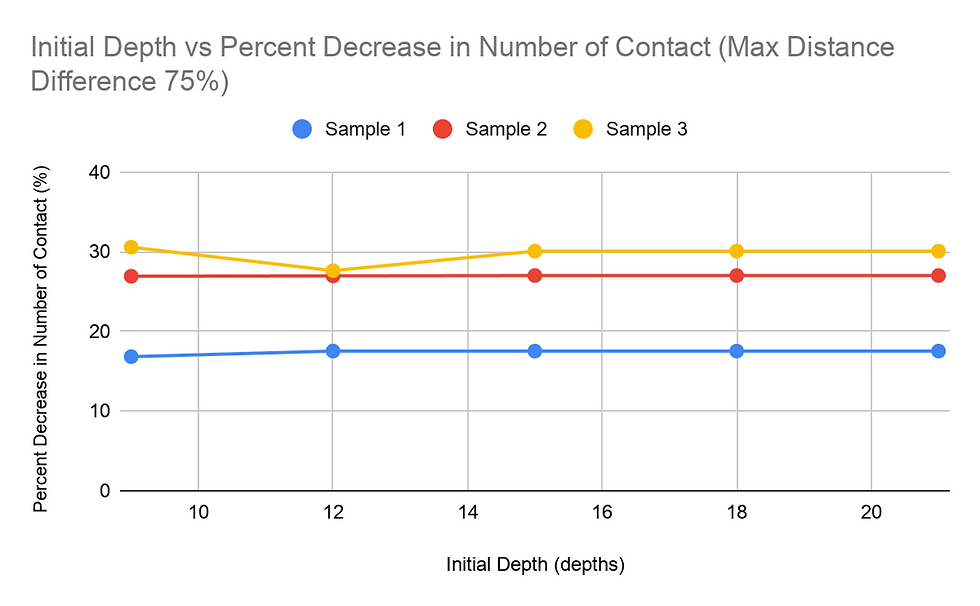
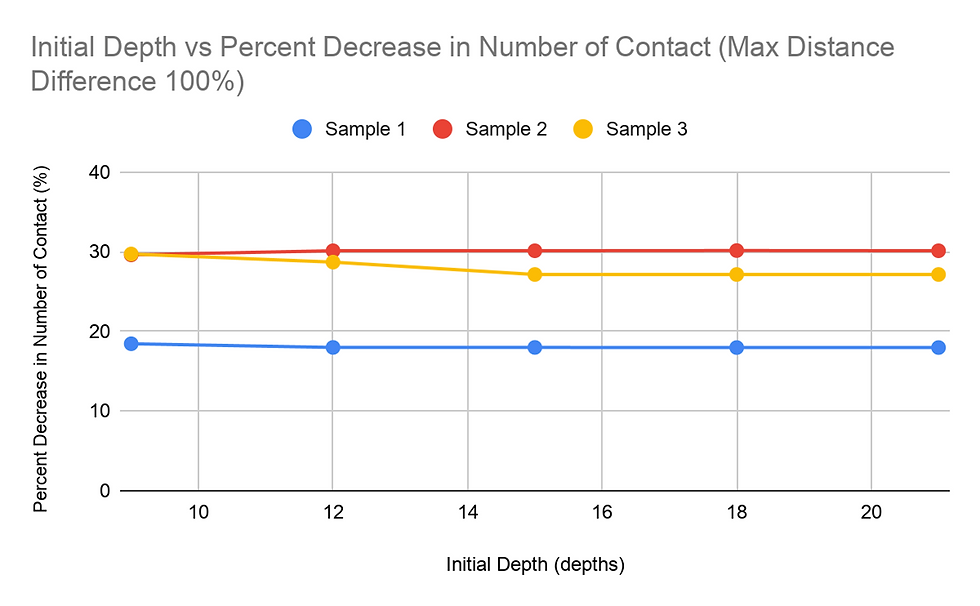
Another study done was on the percent decrease in amount of student to student contact, with the same two independent variables: MDD and ID. For most of the graphs for percent decrease vs. MDD, the general trend was a decreasing value for the percent decrease in the student to student contact as the MDD percentage increased. This trend was overall not too apparent in the graphs. Changing the Initial Depth value, however, did not change the percent decrease by a significant amount.
Data Analysis
The MDD vs. time graphs show a positive correlation between the two variables. The MDD is what enables the algorithm to search beyond the limits of the current found path. With a higher MDD percentage, this limit is loosened, enabling the algorithm to possibly go down further. This trend most likely occurs because a higher MDD value ultimately brings the search algorithms’ searches closer to the worst possible case. The rate of change increasing in these graphs can be compared to a circle enlarging its radius. After the function finds a possible solution, the searchable region theoretically reduces to a circular region with a radius of the possible solution’s distance, increased by the MDD value. Thus, since a circular region can be represented by a second-degree quadratic function, an increase in the MDD value will result in a directly proportional squared increase for the time value.
The ID vs time graph was a bit different, with the graph decreasing and increasing. The time it takes for trials with an ID value of 9 is high. This can possibly be explained by the higher probability of not being able to find the target node within 9 depths, causing the algorithm to search for algorithms much beyond the initially restricting depth value. This, in turn, significantly increases the amount of times it takes for everything to evaluate. At the ID value of 12, Sample 2 took longer while the other two samples took a smaller amount of time. Sample 2 samples taking the longest amount of time in most of the tasks suggests that there are more nodes in Sample 2 that have a large distance between the start node and the target node. As seen in the MDD tests, Sample 2 proved to take the longest in almost every test where the MDD value was held constant. Therefore, since this one takes the longest, the low ID value would not be adequate in efficiently finding the paths for each student. The ID value of 15 was optimal for Sample 2 while 12 was optimal for the other 2. While it is not possible to determine the most optimal ID value for each sample, using the returned value of the findMaxDepth function or a number slightly lower seems most optimal for most cases.
The data on the percent decrease in the number of student to student contact did not show a significant noticeable difference between the trials with either MDD or ID as the independent variable. The percent decrease for these trials varied, from a 15% decrease to a 35% decrease. The range of the percent decrease for trials with one sample with a fixed independent variable was at most 7 percentage figures. Therefore, the percent decrease was more dependent on the data within the sample rather than the variance of the MDD and ID values.
Conclusion
To conclude, increasing the MDD value increased the time it took to compute the student paths. The ID value initially decreased the time it took to compute the student paths and increased after getting close to the value found by the findMaxDepth function. For the test map, the maximum depth was 15 and the trials took the shortest amount of time to calculate the paths when the ID value was 12 or 15. The data also suggested that having a low MDD value was the most optimal. The square of the MDD value was proportional to the time that the algorithm took to finish calculation. There were no significant trends found regarding the impact of MDD and ID on percent decrease in the number of student-to-student contacts.
Discussion
Although there are many efforts to lessen the spread of the coronavirus within schools, there are not any solutions like this. This student pathfinding project most closely resembles the Google Maps algorithm which directs a user to travel on streets and highways that are less crowded. In a sense, the prioritization of paths in Google Maps is shown through the algorithm that linearly assigns the paths for each student for a school map. This algorithm was originally designed only for applications within schools, but this tool can be used for any moving populations to minimize contact between individuals. Since this tool can be used with all data that follows the required import format, this tool can easily be used in other situations, regardless of the size. For example, this app can be used in places where overcrowding is an issue.
The study was mostly geared towards observing the optimization and some of these results are more dependent on the preference of the user/administrator. For example, if the MDD value was set at 0%, the code will be most efficient because it will essentially find only the shortest path from the start node and the end node. This, however, makes the contact lessening algorithm unable to function as intended because there will only be one path for each student. On the other hand, setting the MDD value to 200% would not be reasonable because a student may have to travel on a path from class to class that takes three times as long to travel than the shortest path. Finding the optimal value for the ID is not situation-dependent like the MDD value because there are a set range of values for each map that takes the least amount of calculations to find the paths.
The calculations were done with everything set to a fixed, even the settings and power consumption of the computer. However, there may have been errors during the time that the algorithm ran because although major antivirus apps were disabled, Windows native tasks such as Windows Defender were on. Some systematic checks randomly run by the computer may have slightly impacted the time it took the browser to compute all the calculations. Other different factors in the power input and clock speeds may have also slightly impacted the time it took for the algorithms to be run. However, these results are most likely reliable and accurate because there were no signs of drops in performance and the computer was able to keep the processor cool enough to have no throttling.
Although this algorithm was optimized and brought to a usable state, this project can be furthered and improved. The contact-lessening process is currently linear; an algorithm goes from student to student, assigning the path that would cause the student to meet the least number of other students in the hallway. If a way to optimally traverse through all the permutations is found, this process will produce consistent results and may decrease the number of contacts further. Another consideration worth studying would be the effect of unidirectional flow for certain hallways on the amount of contact and in the pathfinding process. By allowing the traffic to flow in only one direction, edges will only allow one node to enter it, lessening the amount of calculations needed. Additionally, this program can be less time-consuming by using lower level languages such as C++, losing the ease of accessibility but making the algorithm much more efficient.
Works Cited
Balram | April 20, Amrita. “How Online Learning Can Affect Student Health.” The Johns Hopkins News-Letter, The Johns Hopkins News-Letter, 20 Apr. 2020, www.jhunewsletter.com/article/2020/04/how-online-learning-can-affect-student-health.
Beachum, Lateshia. “Georgia School with Photos of Packed Hallways Will Curb in-Person Classes after Coronavirus Outbreak.” The Washington Post, WP Company, 13 Aug. 2020, www.washingtonpost.com/education/2020/08/13/georgia-covid-school-reopening/.
Erickson, Jeff. Algorithms. Jeff Erickson, 2019.
Ptak, Kimberly. “Glenbrook High Schools Board Meeting.” Glenbrook 225 Board, 29 Sept. 2014.
Winston, Patrick Henry. “Lecture 4: Search: Depth-First, Hill Climbing, Beam.” 6.034 Artificial Intelligence (Fall 2010). Artificial Intelligence, 5 June 2020, Cambridge, Massachusetts, Massachusetts Institute of Technology: MIT OpenCourseWare.


Comments